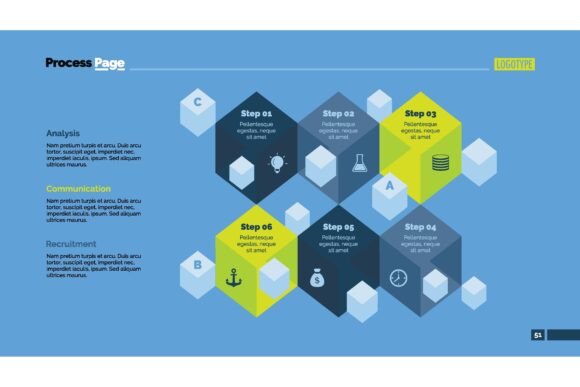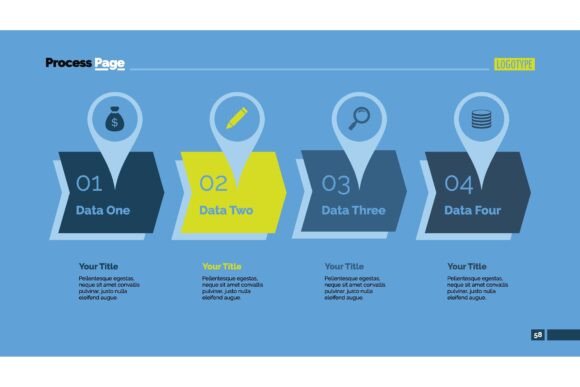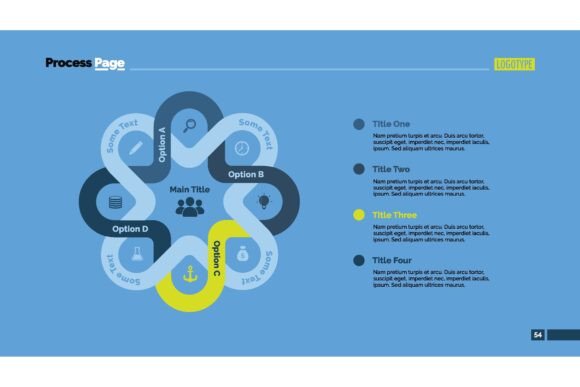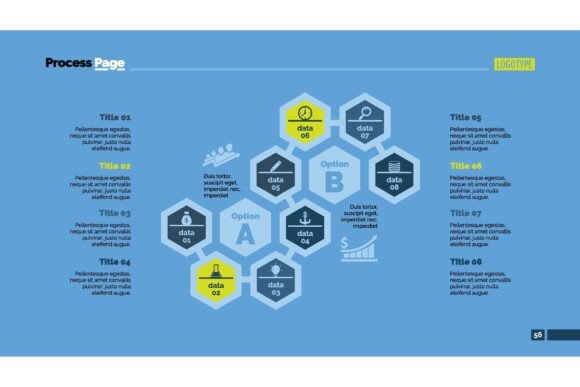
Two Options Process Chart: Simplify Business Data
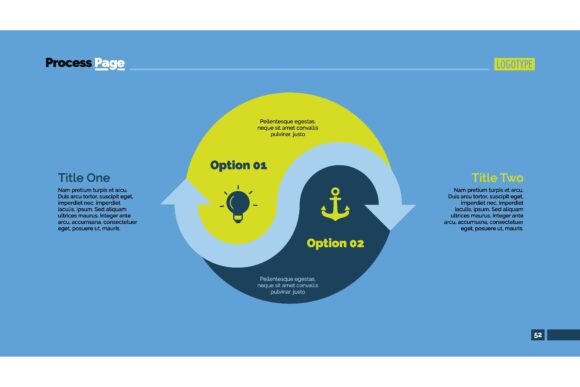
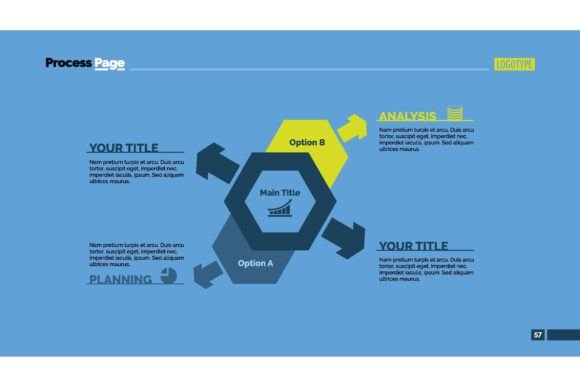
Whether you are comparing marketing strategies, mapping financial projections, or outlining product pathways, a Two Options Process Chart turns raw business data into an easy-to-follow visual story. At its core, this dual-options layout presents two distinct branches from a single starting point, letting viewers quickly grasp trade-offs, parallel outcomes, or contrasting scenarios. It replaces dense paragraphs with shapes, arrows, and crisp labels, making information feel immediately accessible.
Unlike a list of bullet points, the chart organizes logic spatially. You might see a central question or catalyst at the top, then two diverging workflows that highlight differences in sequence, resources, or results. This structure brings clarity to everything from A/B testing results to go-to-market plans. The design is deliberately open-ended: you decide the data, the labels, and the visual style. Because it works equally well inside a slide deck, a printed report, or an online infographic, it has become a go‑to for professionals who need to communicate without clutter.
Why This Format Connects With So Many People
A single chart can mean very different things depending on who is looking at it. For a marketing manager, the same two-option process might help pitch seasonal campaign ideas to a client, showing how each path influences customer reach and budget. For a freelance educator, it becomes a teaching tool that breaks down cause and effect during an online workshop. A small shop owner tracking inventory could adapt the layout to compare vendor reliability or shipping methods.
This variety happens because the chart is not prescriptive. It provides the structure while you bring the context. Some people value its simplicity above all else: no steep learning curve, just drag, type, and present. Others lean on its flexibility, customizing colors and icons to match brand guidelines or personal aesthetic. The format also appeals to those who prioritize clarity over flashiness—you can build a straightforward comparison without overwhelming motion graphics or data-heavy dashboards.
Beginners: A Gentle Entry Into Data Visualization
If you have never created a process diagram before, the two-option approach is an ideal starting point. You do not need to master complex software or study design theory. Most chart templates let you replace placeholder text with your own data, and the symmetrical layout naturally guides your eyes from left to right or top to bottom.
- Ease of use: Predictable structure means you spend less time arranging boxes and more time refining your message.
- Learning value: Working with a dual-option chart teaches basic principles of information hierarchy, which you can later apply to more elaborate visuals.
- Quick wins: A beginner creating a proposal for a class project or a community meeting can produce something that looks polished in minutes, not hours.
Think of someone preparing a comparison of two budgeting methods for a local nonprofit board. The chart helps them avoid word-heavy explanations. They plug in key metrics like initial cost, time commitment, and risk level under each branch, and the board can instantly see the contrast. That immediate understanding builds confidence for both the presenter and the audience.
Intermediate users: Balancing Speed and Personalization
If you have already dabbled in infographics, the two-option chart helps you move faster without sacrificing personality. Intermediate users often juggle multiple projects—maybe a real estate agent needs to show first-time buyers the steps for two mortgage types, or a content creator wants to illustrate a “build vs. buy” decision for a tech review video.
At this level, priorities shift toward reliability and speed. You need a design that adapts quickly to new data without breaking. Because the chart framework is already balanced, you can focus on crafting concise labels and choosing accent colors that keep the viewer's attention. Many intermediate users also begin to layer in subtle branding, such as a logo in the header or consistent font pairings, without reinventing the layout each time.
Professionals: Where Accuracy Meets Narrative
For analysts, consultants, and seasoned project managers, a two-option process chart is not just about looking good—it is about supporting a data-driven argument. When presenting to executives or investors, every arrow and box must align with verifiable numbers. A chart that compares two supply chain models, for example, might include lead times, cost per unit, and failure points beside each workflow step.
Here, the emphasis lands on quality and long-term usefulness. A professional might reuse the same structured template across multiple client engagements, updating only the specifics. This consistency saves time but also builds trust: stakeholders recognize the format and can immediately jump into analysis rather than deciphering a new visual language. Additionally, professionals often need the chart to export cleanly into different formats—print, PDF, interactive web—without losing alignment. When the underlying structure is robust, that export is seamless.
Creators and Marketers: From Information to Inspiration
Visual storytellers look at a two-option chart and immediately think about engagement. They ask: “How can I make this not just clear, but memorable?” A social media manager plotting two content strategies might color-code each branch with the brand palette and inject small icon illustrations to represent platforms or audience segments. A blogger comparing product features could embed the chart directly into a post, giving readers a break from long paragraphs.
For this group, priorities center on creativity and presentation. They appreciate a design that provides enough constraints to keep things organized but leaves room for artistic expression. Cost is rarely a barrier because many versatile chart resources are available for free or at low one-time prices. More importantly, the chart must look good on a phone screen as well as a desktop—responsive scaling is a quiet but vital need for digital-first audiences.
Educators and Trainers: Making Abstract Ideas Tangible
Teachers, workshop facilitators, and instructional designers often work with learners who need to compare concepts side by side. A biology instructor might use a two-option chart to contrast photosynthesis and respiration, while a business coach explains two leadership styles. The visual separation between the branches reduces cognitive load, helping students focus on one path at a time before connecting them back to the main topic.
For these users, flexibility and the ability to reuse a structure are critical. They might print the chart as a handout, embed it in a slide, or share it as a digital worksheet. The chart becomes a framework that learners themselves can fill out, turning passive viewing into active participation. This active element supports retention and deeper understanding, which is often the ultimate goal of any educational setting.
Small Business Owners: Decisions on a Single Page
When you run a small business, you rarely have time for complicated analytics software. A two-option process chart helps you lay out decisions that directly affect your bottom line: choosing between two suppliers, evaluating local versus online advertising, or mapping customer service response flows. The format’s clarity often sparks productive conversations with partners or employees who might not be comfortable reading spreadsheets.
For this audience, the chart’s commercial value comes from turning abstract trade-offs into actionable next steps. A bakery owner comparing a wholesale expansion to opening a second storefront could note upfront costs, estimated revenue, and staffing needs in crisp text boxes. The visual format makes it easier to spot where assumptions differ, and it serves as a living document that can be updated as real-world data rolls in. Reliability matters here—if the chart looks sloppy or misaligned, it can undermine the seriousness of the business case.
Consumers and Hobbyists: Everyday Planning with a Professional Feel
Even if you do not work with business data daily, the two-option logic helps organize personal projects. A hobbyist woodworker might compare two furniture designs, listing materials and tool requirements. A volunteer event planner could map rain and shine contingency plans for a community fair. The polished look of a finished chart adds a sense of accomplishment, and the process of building it often clarifies your own thinking.
Here, low cost and gentle learning curve matter most. You want something that does not require a subscription and that you can open on a regular laptop. Many free or budget-friendly templates include placeholder elements that make sense for personal planning—like timeline markers or percentage bars—so even a one-off project feels thoughtfully presented. Because the chart is so adaptable, a hobbyist can reuse the same template for completely different purposes months later, from travel itineraries to DIY budget breakdowns.
Evaluating If This Chart Fits Your Project
Not every dataset belongs in a two-option format. The layout truly shines when you have two clear alternatives that share a common origin or question. If you are comparing three or more options, a different structure might serve you better. Ask yourself a few straightforward questions before committing:
- Is the core idea about a choice, a split, or a contrast?
- Can each branch be summarized in 3–7 concise points?
- Will the audience benefit from seeing both paths at once rather than sequentially?
- Do I need a visual that can live across different media—slides, documents, social posts?
If you answer yes to most of these, the two-option chart is probably a strong fit. People who thrive on detail might still prefer a spreadsheet alongside the graphic, but for broad communication, the visual wins nearly every time. Remember that the chart is a tool for enlightening your audience, not a replacement for in-depth analysis. Use it to guide attention toward the most important distinctions, and reserve the finer points for discussion or footnotes.
Practical Examples Across Different Roles
Marketing strategist: Maps two launch sequences for a product, highlighting timing, channel mix, and expected noise level for each. The chart helps her team see why one route demands a longer pre-launch phase and inspires a healthier debate about resource allocation.
Freelance graphic designer: Presents a client with two style directions for a branding package. Each branch showcases color palette, typography samples, and a mockup snippet. The client can quickly compare emotional undertones and practical legibility, reducing back-and-forth emails.
Nonprofit coordinator: Compares two fundraising event formats—an in-person gala and a virtual auction. She includes estimated volunteer hours, technology needs, and projected donations. The board uses the chart to decide which format aligns better with the year’s capacity and mission.
Student researcher: Outlines two hypotheses before starting an experiment. The flowchart helps define what data to collect, how to interpret it, and when to pivot. The visual becomes part of the final presentation, making the scientific process transparent to the review panel.
Getting the Most Out of Your Two Options Process Chart
Once you adopt this visual tool, a few small habits can dramatically improve the final result. First, write your labels as if you are talking to someone in a hallway—short, active, and free of jargon unless your audience expects it. Second, honor the symmetry: if one branch lists five attributes, the other should also list five, even if some are “not applicable.” This balance prevents the chart from feeling lopsided or biased. Third, test the chart on a person unfamiliar with your topic. If they can explain the two options back to you without prompts, you have succeeded.
Finally, think about long-term usefulness. Save your chart in an editable format so you can update numbers or wording as situations evolve. What starts as a one-time client deliverable might become a reusable asset you adapt for future proposals. The same logic applies to personal projects: a home renovation comparison chart can be tweaked next year when planning a vacation budget.
The Two Options Process Chart. Business Data concept endures because it mirrors how we naturally process decisions. We weigh one path against another constantly, and a well-crafted visual simply externalizes that mental model in a shareable, elegant way. Whether you are a first-time diagrammer or a seasoned analyst, the key is to let the structure do the heavy lifting while you focus on the story that only you can tell.