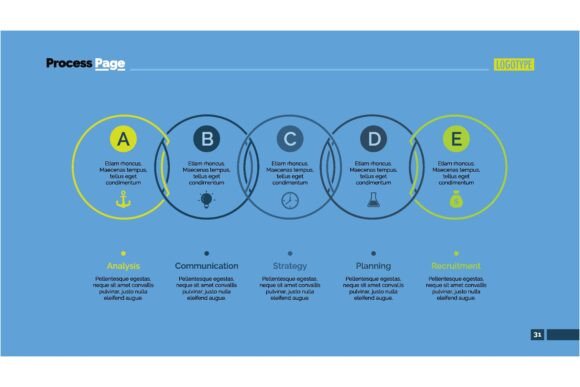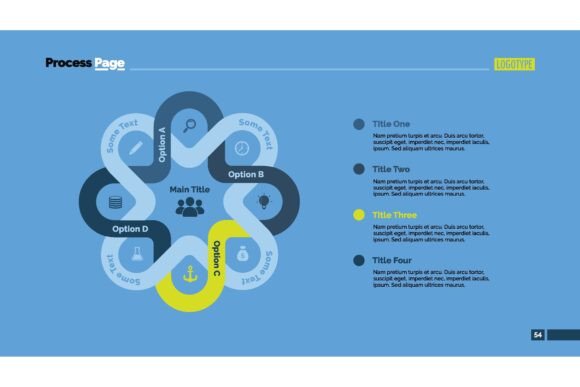
Making Sense of Multiple Paths with the Four Options Process Chart Slide Template
There’s a moment in almost every meeting when someone grabs a whiteboard marker and draws four circles. It’s instinctive. We naturally break down complex problems into four chunks because that’s how we create order out of chaos. The Four Options Process Chart Slide Template takes that universal instinct and transforms it into a polished, instantly understandable visual. You’re not just dropping shapes onto a slide; you’re giving a group a shared mental model that reduces friction and accelerates decision-making.
What a Four Options Process Chart Actually Does
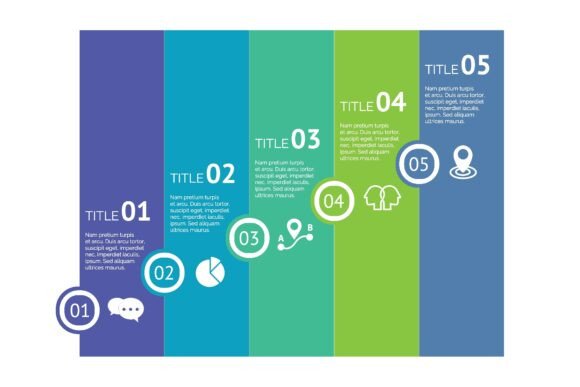
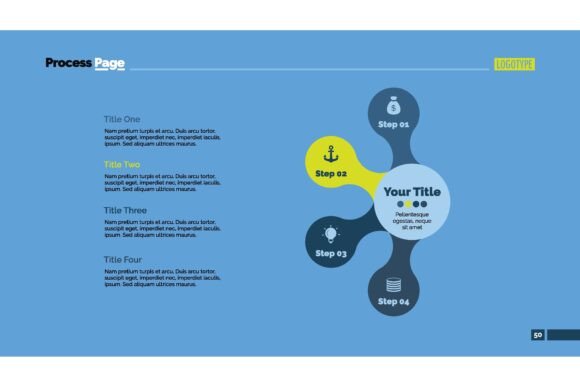
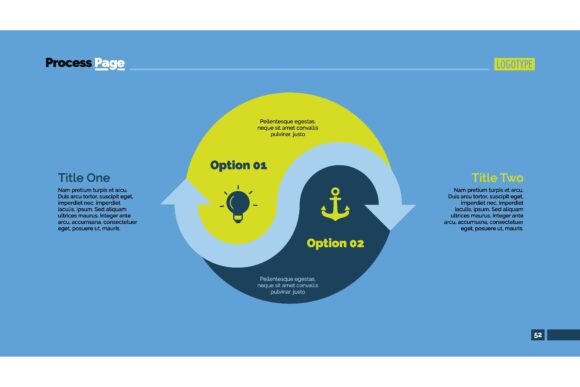
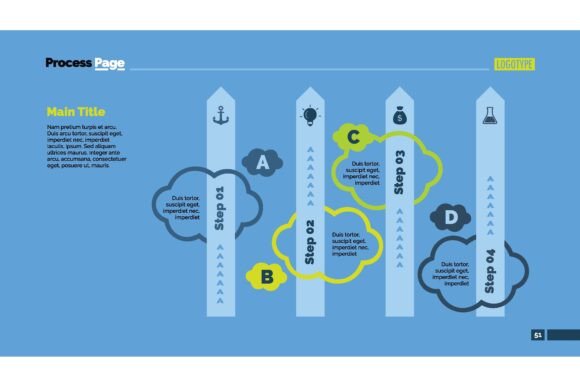
At its core, this type of template isn’t about decoration. It’s about structure. A well-built four options process chart places four distinct paths, phases, categories, or strategies right next to each other, allowing the audience to compare them without splitting their attention across multiple slides. The design often includes color-coded segments, circular or diamond-shaped connectors, and clean iconography that instantly signals relationship – whether it’s a sequential flow, a quadrant analysis, or a balanced set of alternatives.
Think of it as a visual conversation anchor. Instead of saying “we have four possible approaches” and watching everyone mentally juggle ideas, you display them simultaneously. The brain processes images faster than language, so that single slide becomes a reference point that keeps people focused on the logic, not the noise. The Four Options Process Chart Slide Template leans into this hard, with graphics that feel both professional and intriguing – no generic bullet points in sight.
Where This Layout Shines: Real-World Scenarios
The beauty of a four-option framework is that it flexes to fit almost any context where you need to present alternatives without overwhelming your audience. Let’s walk through a few places where it becomes a genuine problem-solver, not just a pretty slide.
Strategic Planning Sessions
You’re facilitating a quarterly review and the leadership team is weighing different growth strategies. One person pushes for market penetration, another insists on product development, someone else whispers about diversification. Using a four options process chart, you can map each strategy to a clear quadrant, complete with short descriptors and a key risk/reward visual cue. Suddenly, the debate shifts from “I think we should…” to “Let’s compare what’s actually in front of us.” The template helps you move from opinion to analysis without anyone feeling sidelined.
Project Kickoffs and Risk Reviews
A project manager staring at a complex initiative can quickly lose the team in Gantt charts. Instead, overlay a four-option layout to categorize risks: people risks, technical risks, timeline risks, and budget risks. Or break the project lifecycle into four phases – Initiate, Plan, Execute, Close – with each segment highlighting the key deliverable. This approach works wonders for cross-functional teams because it creates a common language. Even stakeholders who dip in and out of meetings can grasp the overall roadmap at a glance.
Training and Onboarding Programs
Learning and development professionals often struggle to make process-heavy content memorable. Take a customer service training module: you might present the four critical steps of handling a complaint. Place each step in its own visually distinct pod, accompanied by an icon that taps into emotional memory – a listening ear, a checkmark, a return arrow. The Four Options Process Chart Slide Template gives you that foundation. Trainees remember the flow not as a list but as a journey with clear signposts, which improves recall long after the session ends.
Product Comparisons and Go-to-Market Decisions
Marketing teams live in a world of trade-offs. When evaluating pricing models, messaging angles, or channel strategies, a four-option framework cuts through the clutter. Imagine comparing a freemium model, a subscription tier, a one-time purchase, and a usage-based model. Each option sits in its own quadrant with essential details like target audience segment and estimated ROI. The visual balance invites discussion about trade-offs without making any single option look like an afterthought. That’s a powerful psychological shift – you’re not forcing a “right answer,” you’re enabling a reasoned choice.
Why Different Audiences Find It So Useful
The versatility of a four options process chart means it speaks different languages to different people, yet retains the same structural clarity.
For managers and team leads, it’s a delegation tool. By outlining four distinct workstreams or priorities, they can assign ownership clearly while keeping the big picture visible. An operations manager might map four continuous improvement initiatives and then hand each quadrant to a different lean practitioner – everyone sees how their piece fits.
Consultants and analysts love the layout because it scaffolds their recommendations. Instead of delivering a dense report, they can present findings under four thematic areas, supported by data callouts. The design does some of the persuasion lifting, conveying credibility through order and visual polish. Clients often perceive the content as more authoritative simply because it’s easy to digest.
Entrepreneurs pitching to investors get a tactical edge. A four-option go-to-market slide shows the thought process without bogging the room down. You can present four customer acquisition channels and the expected conversion rates, then highlight your chosen path. The contrast between options validates that you’ve done your homework, which builds trust.
Educators and facilitators tap into the template to organize workshops. A four-stage model – Explore, Define, Ideate, Prototype – transformed into a slide encourages active participation. Students or attendees mentally place themselves in the process, which deepens engagement.
The Designer’s Edge: Visual Storytelling Without the Chaos
Not all four-option slides are created equal. The difference between a mediocre grid and the Four Options Process Chart Slide Template lies in the thoughtful integration of graphics. The diamond-shaped intersecting flows or circular hub-and-spoke designs often featured in this template create a sense of motion. You’re not staring at static boxes; you’re witnessing a system at work. Color gradients draw the eye naturally from one concept to the next, while consistent iconography reinforces meaning. The result is a slide that looks custom-built for your story, even if you just dropped in your content.
This isn’t just about beauty – it’s about cognitive ease. When an audience member’s brain doesn’t have to work hard to parse the layout, it can devote energy to your message. Complex ideas like balanced scorecards, SWOT analysis, or BCG matrix variations suddenly feel accessible. You preserve nuance without sacrificing clarity, which is a rare combination in business communication.
When Four Options Becomes the Sweet Spot
There’s a reason the four-option layout appears in so many strategic frameworks. Humans can comfortably hold about four chunks of information in working memory before things get fuzzy. Two options can feel binary and confrontational; six options cause analysis paralysis. Four sits right in the productive middle ground. It encourages comparison without exhaustion. This template capitalizes on that cognitive sweet spot by making each option distinct yet visually equivalent – no hierarchy is implied unless you deliberately break it with size or color emphasis.
You might be presenting a phased roadmap: Phase 1 through Phase 4. Or a decision matrix with criteria like Cost, Impact, Feasibility, and Alignment. The structure prevents the natural tendency to rank prematurely. In strategic discussions, that neutrality is gold. It allows quieter voices to advocate for the “underdog” option without appearing confrontational, because the layout treats all ideas as valid contenders.
Things to Keep in Mind Before You Rely on a Four-Option Layout
Like any tool, the four options process chart has its boundaries. Recognizing them helps you use it wisely rather than forcing a square conceptual peg into a round hole.
First, consider the reality of your content. If you genuinely have only three compelling options, don’t stretch to invent a fourth just to fill the template. Audiences notice filler content, and it dilutes your credibility. You might adapt by using the fourth quadrant for a “watch list” or “future considerations” – but only if that adds value. The Four Options Process Chart Slide Template is flexible enough to handle slight customizations, but the core strength comes when you have four genuinely meaningful branches.
Second, depth matters. A process chart shines at showing overviews and relationships, but it can’t contain lengthy explanations. Pair it with speaker notes or break-out slides if each option requires deep dives into data or narrative. Think of it as a visual executive summary – powerful at the 30,000-foot level, but you still need the landing gear.
Third, audience familiarity with quadrant-based thinking varies. A technical team might instantly grasp a four-option framework; a group of frontline employees may need a few seconds of orientation. Briefly walk through the structure once before diving into details. The template does a lot of the orienting for you through intuitive design, but a human touchpoint ensures nobody feels lost.
Practical Ways to Adapt the Template for Your Context
You don’t need to be a design expert to make this work for you. Start by clarifying the relationship you want to show. Are the four items equal alternatives, sequential stages, or components of a whole? Decide that first, then align the template’s visual cues accordingly. If it’s a process, emphasize arrows and directional flow; if it’s a comparison, use distinct colors with no implied sequence.
Layer brief, jargon-free labels that even an outsider could understand. One team I worked with replaced “Synergistic Holistic Engagement” with “Work Together Better” on a quadrant and saw engagement spike instantly. The graphic quality of the template elevates even simple language, so don’t overcomplicate.
Finally, treat the slide as a living document. As your project evolves, update the four options. During a long-term consulting engagement, one client used the same Four Options Process Chart Slide Template across multiple check-ins, each time refining the quadrants to reflect real-time data. It became a shared dashboard that tracked progress without needing a separate report. When stakeholders saw the same visual language month after month, trust and continuity deepened.
The Quiet Power of Clarity
In a world where attention is the scarcest resource, a slide that instantly clarifies rather than confuses is a competitive advantage. The Four Options Process Chart Slide Template doesn’t just hold your content – it transforms it into a visual argument that sticks. Whether you’re navigating a boardroom debate, training a new cohort, or pitching a venture, that kind of clarity isn’t a luxury. It’s the difference between being heard and being remembered. And often, it starts with four simple, perfectly balanced quadrants that feel less like a template and more like the shape of a good idea.