Bringing Business Data to Life with the Six 3D Cubes Process Chart
Numbers and steps can feel flat on a screen. You might have brilliant insights buried in a spreadsheet, but the moment you present them, eyes glaze over. That disconnect between meaningful data and audience engagement is real, and it happens in boardrooms, virtual meetings, and classrooms alike. The Six 3D Cubes Process Chart offers a way to bridge that gap by turning ordinary sequences into dimensional, memorable visuals that hold attention and invite curiosity.
What Actually Is the Six 3D Cubes Process Chart?
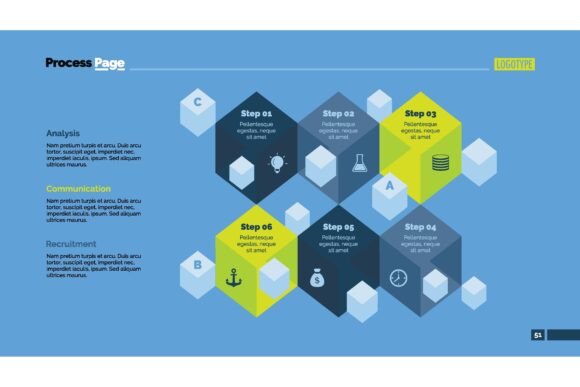
At its core, this is a graphics set built around six cube-shaped elements arranged to show a process, progression, or relationship. Each cube represents a distinct stage, idea, or data point, and the three-dimensional treatment gives the layout a tactile, almost physical presence on the screen or printed page. Instead of flat arrows and boxes, you get depth, shadow, and perspective that make people want to lean in and explore.
The design works as an infographic foundation, a presentation slide, or a report illustration. You can drop it into existing templates or use it as the starting point for something entirely original. The six-cube structure naturally fits sequences that have a beginning, middle, and end, but it is also flexible enough to represent parallel ideas, comparative data, or hierarchical relationships. Because the cubes look solid and grounded, they communicate stability and structure, which can subtly reinforce the message you are delivering.
Where This Chart Shows Its Real Value
Visual tools only matter when they solve an actual problem. The Six 3D Cubes Process Chart earns its place in situations where clarity, persuasion, or memorability are at stake. Think about the last time you tried to explain a multi-step strategy to a client who was already distracted. Or the team meeting where you walked through a quarterly plan and half the attendees nodded without truly absorbing the details. In those moments, the difference between a forgettable slide and one that sticks often comes down to how the information feels as people encounter it.
Marketing Presentations That Stick
Marketers regularly present campaign flows, customer journeys, and content strategies. A flat diagram might convey the steps, but a 3D cube layout signals intentionality. Picture a marketing lead showing a six-month content rollout: each cube represents a month, color-coded by campaign theme, with key metrics labeled on each face. The audience sees the full arc at a glance, and the depth of the cubes subtly suggests substance behind each stage. This is not decoration for its own sake; it is a way to help stakeholders grasp the rhythm of the plan without mentally translating abstract shapes first.
Training Sessions That Reduce Confusion
Trainers and educators frequently deal with processes that learners need to internalize, whether it is onboarding procedures, software workflows, or safety protocols. The six-cube format breaks complex sequences into digestible chunks. A compliance trainer might map regulatory steps onto each cube, with icons and short labels that form a visual checklist. When trainees see the cubes arranged in perspective, they instinctively understand that the steps are connected yet distinct, and the 3D treatment helps the sequence register as something concrete rather than theoretical.
Production and Operations Walkthroughs
Manufacturing environments and operations teams often rely on linear diagrams to document assembly steps, quality checkpoints, or supply chain milestones. The Six 3D Cubes Process Chart can turn a static checklist into something that resembles an actual physical flow. A production manager might use the cubes to illustrate material movement from receiving through inspection, assembly, testing, packaging, and dispatch. The spatial layout mimics how materials physically travel through a facility, making the diagram intuitive even for new hires who have not yet memorized the floor plan.
Small Business Strategy and Planning
Small business owners wear many hats and rarely have time to design polished visuals from scratch. When they sit down with a potential investor, a bank loan officer, or a new partner, the quality of the presentation reflects on the business itself. The Six 3D Cubes Process Chart gives them a professional-looking structure to build around. A bakery owner explaining expansion plans might dedicate each cube to a focus area: product development, location scouting, staffing, marketing, equipment investment, and launch timeline. The visual cohesion signals preparedness and seriousness without requiring a design background.
Freelance Pitches and Client Deliverables
Freelancers depend on clear communication to win projects and maintain relationships. A graphic designer, web developer, or consultant can embed this chart into a proposal to outline their workflow, timeline, or service package breakdown. When a client sees a 3D visualization of how the project will progress from discovery through delivery, they feel more confident about what they are buying. The visual removes ambiguity, and the polished aesthetic reassures them that they are working with someone who values presentation quality.
Educational Content and Online Courses
Online course creators and bloggers often explain frameworks, methodologies, and learning paths. A six-step process chart becomes a reusable template for different lessons. One module might use the cubes to explain the stages of design thinking; another might map them to the writing process. Students begin to recognize the visual pattern, which speeds up comprehension over time. The 3D aspect keeps the slides from feeling repetitive, even when the same structure appears multiple times throughout a course.
Real Benefits Different Users Notice
What someone gains from this chart depends on their starting point. For the entrepreneur, the benefit is credibility. Showing up with a visually compelling diagram shifts how people perceive the business, especially in early-stage meetings where trust is still forming. For the educator, the benefit is retention. Learners remember information anchored to spatial layouts more easily than bullet points alone. For the corporate professional, the benefit is efficiency. Fewer clarifying questions after a presentation means less time circling back and more time executing.
The versatility also matters for people who juggle multiple roles. A blogger who also runs workshops and consults on the side can reuse the same graphics set across blog graphics, slide decks, and client reports, maintaining a consistent visual identity without commissioning custom illustrations for each context. That kind of flexibility reduces both cost and cognitive load.
Practical Ways People Apply the Six Cubes
To ground this in everyday reality, consider how different scenarios play out. A real estate agent preparing a listing presentation might assign each cube to a phase of the selling process: valuation, staging, photography, marketing, showings, and closing. The seller sees the full roadmap at once, and the agent appears organized and thorough. A nonprofit director writing a grant proposal could map program components onto the cubes to show funders exactly how their contribution fits into a larger ecosystem. A fitness coach designing a 12-week program could chunk it into six two-week blocks, each cube representing a progressive phase that builds on the previous one.
These are not hypotheticals. Professionals in every field deal with sequences, and they struggle to make those sequences feel real to the people who need to understand them. The chart does not replace the thinking behind the work; it amplifies the thinking that is already there.
What to Consider Before Using This Graphics Set
Not every presentation needs 3D treatment, and good judgment matters. The chart works best when the content genuinely benefits from spatial emphasis. If you are presenting two or three simple bullet points, a cube layout might feel forced. But when you have a clear six-part structure with meaningful distinctions between stages, the format aligns naturally. Overusing a visual gimmick can dilute its effect, so reserve the cubes for places where they support the message rather than distract from it.
Also think about your audience and medium. A printed handout benefits from high-resolution graphics, while a video presentation might need the cubes to be legible on small screens. Test the viewing experience beforehand. Colors should contrast well, labels should be readable at the intended size, and the perspective should not distort important details. Most modern graphics sets accommodate these needs, but a quick review saves you from discovering issues mid-presentation.
Another practical consideration involves branding. The Six 3D Cubes Process Chart typically allows customization of colors, text, and sometimes textures. Take the time to align the visual with your brand palette and typography. Consistency across slides, documents, and web pages reinforces your identity. When the chart looks custom to your organization, it carries more authority than if it appears to be a generic template dropped in without any adjustment.
Why Depth Changes How People Process Information
Flat diagrams communicate information, but they rarely communicate weight. A 3D cube implies substance in a way that a rectangle simply cannot. This psychological effect is not trivial. When stakeholders see a process laid out in dimensional form, they attribute more importance and structure to the content. The visual suggests that thought and effort went into the presentation, which primes the audience to receive the information more seriously. The cubes also create natural focal points, guiding the viewer's eye through a sequence in an intended order without requiring arrows or numbered lists as prominently.
For people who regularly need to sell ideas internally or externally, this subtle shift in perception can be genuinely meaningful. It is not about tricking anyone. It is about matching the presentation quality to the quality of the thinking behind it.
Turning Your Data into Something People Remember
Business data is only as valuable as the decisions it prompts. If your audience does not absorb the insights, the data might as well not exist. The Six 3D Cubes Process Chart serves as a translation layer between raw information and human understanding. You are not just showing steps; you are building a mental model that people can revisit later, long after they have closed the deck or filed the report.
Whether you are a marketer mapping campaigns, a trainer simplifying complexity, or a founder making your case, the goal remains the same. You want people to get it, remember it, and act on it. A well-placed visual is not the whole story, but it frequently makes the difference between a message that lands and one that drifts away unnoticed. In a world packed with information, that edge matters more than most people admit.