Analysis System Icons: Streamlined Visuals for Modern Projects
When every pixel matters and clarity drives comprehension, the right icon set turns abstract data into immediate understanding. That’s where Analysis System Icons come into play—a carefully crafted collection designed to support digital products, printed materials, and everything in between. Instead of hunting through mismatched libraries or settling for generic shapes that dilute your message, you get a cohesive system built around the core ideas of measurement, insight, and growth. Whether you’re refining a SaaS dashboard, laying out an annual report, or building an educational infographic, these icons help you communicate with precision without saying a word.
What Makes Analysis System Icons Different?
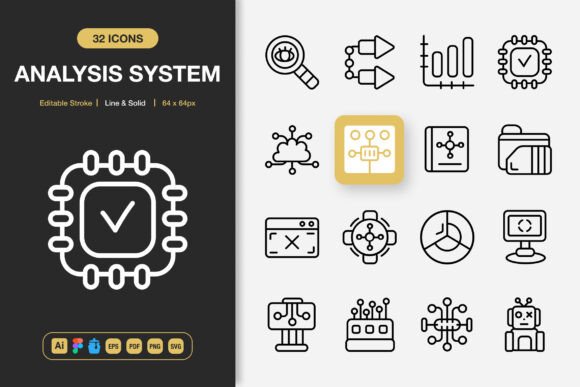
Most icon packs promise versatility but deliver cluttered outlines or inconsistent weights. This set was developed with an intentional modular approach. Every icon—from simple bar charts and trend lines to funnel diagrams and percentage badges—shares the same underlying grid structure and optical balance. That means when you place a pie chart icon next to a target icon or a magnifying glass glyph, they feel like they belong together. The result is a visual language that reads as intentionally designed, not assembled from random sources.
Two distinct styles, line and solid, run throughout the entire collection. The line style offers precision and a contemporary, airy feel that suits modern interfaces and editorial layouts. The solid version delivers weight and impact, making it ideal for highlighted states, key metrics, or mobile app bottom navigation where legibility at small sizes is critical. Having both variants in one package eliminates the need to commission separate sets or compromise on design direction midway through a project.
Beyond the dual styles, the real power lies in the editable stroke capability. With vector source files at your fingertips, you can adjust line thickness, change corner rounding, or modify terminal styles in seconds. A financial dashboard might need a slightly bolder stroke for data visualization icons, while an airy lifestyle app benefits from a thinner, elegant line. Instead of accepting a designer’s single interpretation, you fine-tune every icon to match your brand’s exact visual traits. This level of control is rare in off-the-shelf icon packs and speaks directly to professionals who refuse to let a visual asset dictate design choices.
Where These Icons Deliver Real Value
The flexibility of the Analysis System Icons set comes from its broad applicability. It’s not limited to a single industry or medium. Here’s how different roles can put it to work immediately.
User Interfaces and Digital Products
For product designers, interface clarity is non-negotiable. These icons handle navigation labels, filtering controls, and dashboard cards with equal confidence. A weather app might use the temperature gauge and humidity icons, while a project management tool relies on Gantt chart previews, resource allocation symbols, and Kanban board indicators. Because each icon is built on a 24×24 pixel grid with consistent padding, misalignment and visual noise vanish. The PNG transparency files allow quick prototyping in Sketch, Adobe XD, or even simple drag-and-drop mockups, while the SVG and Figma files integrate directly into component libraries for scalable, code-ready output.
Marketing Collateral and Data Storytelling
Marketers and content creators frequently translate complex data into compelling visuals. Infographics, social media carousels, and email campaigns benefit enormously from icons that break down statistics without oversimplifying. Imagine a LinkedIn post showing quarterly growth: a line-style upward arrow paired with a solid percentage badge immediately signals progress. Because the strokes are editable, a brand team can match the icon weight to the company’s custom typeface, strengthening brand consistency across every touchpoint. The EPS Version 10 and PDF files slot straight into professional layout software like InDesign or Illustrator, giving print designers the same crisp results for flyers, brochures, and conference banners.
Publishing and Educational Content
Authors, educators, and curriculum developers need clear, distraction-free imagery. Textbooks, workbooks, and digital courses often explain processes, cycles, and comparative data. The analysis icons—like Venn diagrams, flowcharts, and comparison scales—help readers grasp relationships faster than a paragraph of text. In children’s educational materials, the solid style provides the bold simplicity young eyes need, while the editable stroke means you can adjust thickness for accessibility without introducing new assets. Even a hobbyist creating a printable budget planner or a habit tracker finds immediate value, because the icons don’t require a design background to look polished.
Brand Identity and System Building
For freelancers and small business owners, every asset must work hard. Instead of purchasing separate icon families for different contexts, you can build an entire sub-brand around this set. The 100% customizable foundation means you can recolor the entire pack to your palette in a single batch action, export specific icons as SVGs for your website, and keep the Iconjar file as a searchable desktop reference for quick access. Over time, as your brand evolves, the editable vector source files allow you to reshape icons rather than replace them—a subtle but significant cost and consistency advantage.
Practical Considerations When Implementing the Set
Even the best icon set needs thoughtful deployment. First, audit the screens or layouts where icons will appear. Are they small mobile tap targets? If so, prioritize the solid style at 24px or larger and test for touch accessibility. For dense dashboards, the line style often reduces visual weight, but ensure the stroke remains thick enough to avoid disappearing on low-resolution displays. The good news: because you control the stroke, you can incrementally thicken it for small sizes while keeping thin strokes for larger hero graphics.
Color application matters. While the PNG files with transparency are convenient, using the included SVG or Figma file as a master source lets you apply dynamic color changes via CSS or component overrides. A designer might set the default icon color to a neutral gray but programmatically turn a warning bell red when thresholds are breached—something not possible with flat raster images. The drag-and-drop simplicity of the PNGs is ideal for non-technical team members working in Canva or PowerPoint, while developers benefit from the text-based SVG format that weighs next to nothing.
Always keep the Readme.txt handy. It contains licensing details, file structure explanations, and quick tips for searching the Iconjar file. If you’re managing a large team, store the source Adobe Illustrator file in a shared drive with clear naming conventions. That way, any future customization—like adding a plus sign to a chart icon or combining two symbols—starts from the original, editable artwork rather than a degraded copy.
Why Minimalist Icon Design Still Wins
In an era of flashy gradients and 3D illustrations, minimalist icons remain the backbone of functional communication. They load instantly, reduce cognitive load, and translate across cultures with minimal localization. The Analysis System Icons embrace this principle fully. There’s no trendy clutter or exaggerated drop shadows that will date your project in six months. Instead, every shape is distilled to its essential meaning. A target icon looks like a target, not a stylized abstraction you have to decode. This clarity speeds up user understanding and reduces the need for labels—a major plus for mobile app navigation and international products.
The line and solid synergy also future-proofs your design system. Suppose you start with a solid-style mobile app and later introduce a web version that calls for a lighter aesthetic. You don’t hunt for a matching set; you simply switch to the line variant from the same family. All the proportions, metaphors, and grid alignments stay consistent, so your brand feels unified across platforms. That kind of design cohesion is what separates amateur projects from professional, scalable products.
How to Get the Most from the Included File Formats
- Source Adobe Illustrator (.ai) and EPS Version 10: Best for deep customization and print production. Open in Illustrator to modify anchor points, generate additional derivative icons, or export artboards at any resolution.
- Figma File: Drag the file into your Figma workspace to instantly populate a design system. Use component instances to maintain a single source of truth and push changes globally.
- Iconjar File: Search, filter, and drag icons directly into Sketch, Figma, or XD. The tagging structure inside Iconjar lets you find “growth” or “conversion” icons in seconds—huge time saver during tight deadlines.
- SVG and PDF Files: SVG powers the web with resolution-independent crispness and tiny file sizes. PDFs serve print designers who need to place icons into layouts without conversion.
- PNG Transparency: The fastest path to a mockup or social media graphic. Drop it onto any background color without white boxes, resize conservatively, and it works in virtually any software.
For anyone who’s wasted hours trying to wrangle mismatched free icons into a unified interface, the convenience here is palpable. Instead of stretching, recoloring, or redrawing, you simply choose the appropriate format and start building. The easy drag and drop promise extends beyond the PNGs; Iconjar and Figma integrations make the entire library feel native to your workflow.
Realistic Observances from Long-Term Use
Over multiple projects, a few patterns emerge. The icons save the most time in the early wireframing phase—you can place recognizable visuals before a single custom illustration is commissioned. Stakeholders understand functionality faster, and feedback focuses on layout and flow rather than confusing placeholder boxes. Later, when visual polish matters, the same icons scale up to production quality because the vectors are clean and the strokes are mathematically aligned.
One overlooked benefit: reduced app and website load times compared to custom illustrations. A full set of SVG icons often weighs under 100KB, meaning your analytics tool or dashboard loads almost instantly even on slower connections. Coupled with lazy loading or sprite sheet techniques, the performance impact is negligible, yet the perceived quality is high.
That said, no icon set covers every conceivable metaphor. Sometimes you’ll need to combine two icons or create a unique variant. The editable source files make this possible without starting from scratch. A designer can open the AI file, copy the donation icon, and combine it with a growth arrow to represent fundraising analytics. Because the original strokes and grid are maintained, the new icon doesn’t introduce inconsistency. This extensibility transforms the icon set from a static collection into a living design asset that grows with your needs.
Final Thoughts on Choosing Your Next Icon System
Icons do heavier lifting than we often give them credit for. In dashboards, they filter attention; in presentations, they anchor memory; in apps, they guide behavior. Selecting a set that’s purpose-built for analysis and metrics ensures your message of progress, insight, and strategy is visually reinforced at every glance. The Analysis System Icons package delivers that through a thoughtful blend of minimalist aesthetics, editable engineering, and multi-format convenience. It doesn’t promise to solve every design challenge, but it removes the friction that plagues so many visual projects—inconsistent weights, limited styles, and file format headaches.
When your next project demands data visualization, performance metrics, or research-oriented graphics, consider starting here. Whether you’re creating a complex SaaS product, a compelling investor pitch deck, or an engaging classroom game, these icons help you work smarter and look more professional from the first pixel. The inclusion of high-quality, customizable, and drag-and-drop-ready assets means you spend less time managing image assets and more time shaping the experiences that truly matter.